[Assignment 17 part 1] Below is a set of maps I made using GeoDa, which is an open source software, to analyze relationships between households receiving public assistance and average household size in the sub-boroughs of NYC in 2000.
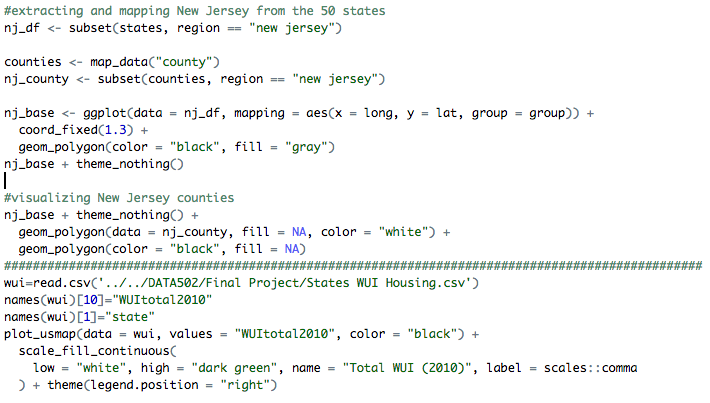
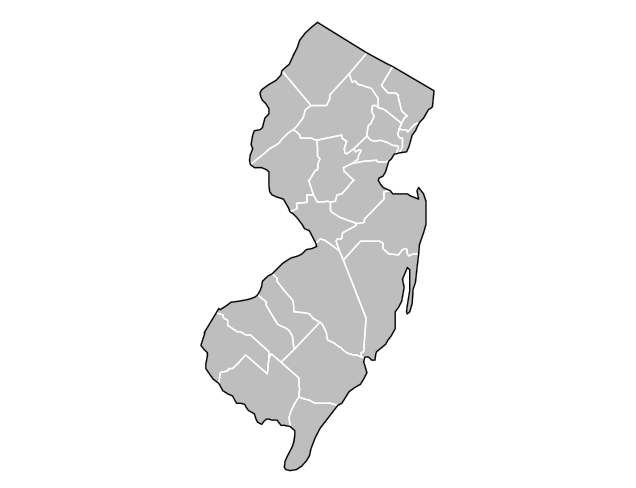
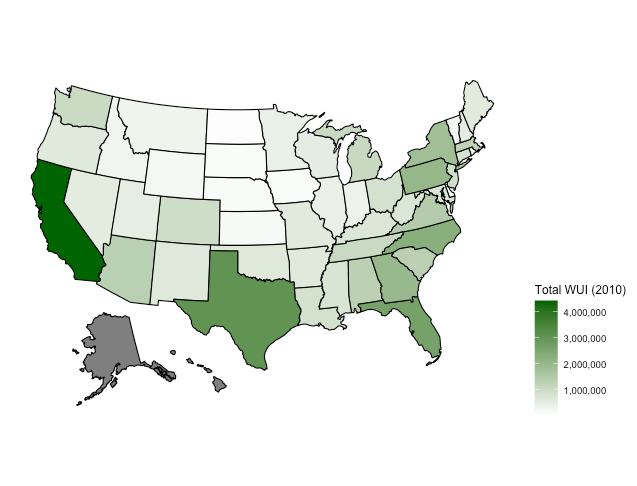
[Assignment 17 part 2] Below are two maps I made using R Studio, which is another open source software. The first map is of New Jersey and the second map is of the United States and maps total WUI housing units in 2010 by state. Refer to my story map (assignment 12) or my midterm project for more details on what the wildland-urban interface (WUI) is. From the second map, it is evident that California has the most housing units in the county. Here is my code: