[Assignment 18] Figure 1 below shows total housing units in the WUI by county in the state of California using data obtained from the University of Wisconsin-Madison SILVIS LAB.
Figure 1. Total WUI Housing Units By County in California, 2010
As shown in Table 1 below, the average number of housing units in the WUI in 2010 for the state of California was 76,324 housing units. Los Angeles County has the most housing units in the WUI (560,926 housing units). Figure 1 above confirms this since this county has the darkest shade of blue, indicating a very high value. The total number of housing units in California in 2010 was more than 4.4 million.
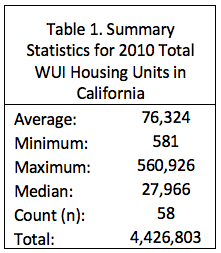
I also wanted to see what kind of relationship exists between WUI housing units and median income. Figure 2 below depicts this relationship by plotting total WUI housing units in 2010 against median household income as defined by HUD. There is a moderate, positive correlation (r=0.37) between these two variables. The number of WUI housing units predicts only 13.7% of the variation in median household income.